How Many Clusters Do I Have?#
A common question in clustering methods, particularly those that require a pre-defined number of clusters, is “how many clusters?”.
A few approaches can be taken to answer this; here, we will discuss the elbow plot, but there is also the silhouette plot.
For more information about the latter, scikit-learn has a nice article discussing them.
k-Means Elbow Plot#
The elbow plot has previously been discussed in the context of principal components analysis. However, in PCA, the y-axis is the proportion of the explained variance, a parameter that is not necessarily generated from k-means or other clustering approaches. Therefore, a different metric is necessary.
A popular metric that is used for an elbow plot in clustering is inertia, \(I\), which is calculated as,
i.e., the sum of the squared distances between the samples, \(x\), and their closest centres, \(\mu_c\).
This metric is calculated using the sklearn.cluster.KMean fit method.
Let’s test this with another simple fake blob dataset.
import matplotlib.pyplot as plt
import pandas as pd
import seaborn as sns

data = pd.read_csv('../data/elbow_blobs.csv')

sns.jointplot(x='x1', y='x2', hue='Label', data=data, kind='scatter')
plt.show()
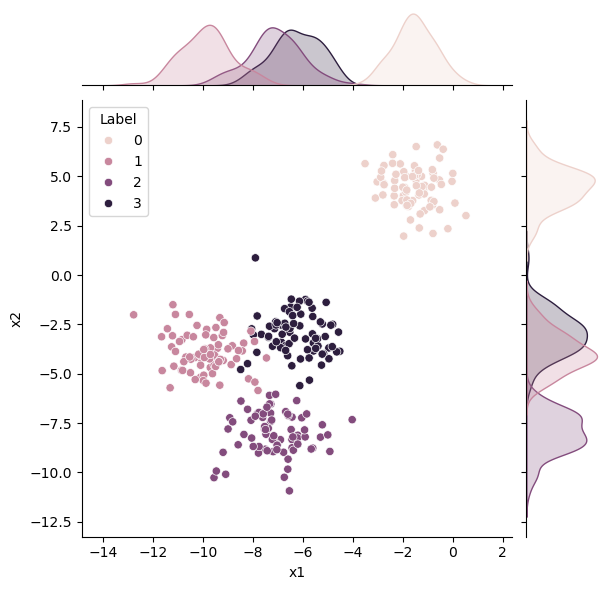
We can see that there is some clustering of the data. There should be four clusters; however, we can see some overlap, so what is the “ideal” number of clusters from this dataset? Let’s use an elbow plot to investigate this.
import numpy as np
from sklearn.cluster import KMeans

inertia = np.zeros(5)
for i in range(1, inertia.size+1):
    kmeans = KMeans(n_clusters=i, random_state=42)
    kmeans.fit(data.drop('Label', axis=1))
    inertia[i-1] = kmeans.inertia_

fig, ax = plt.subplots()
ax.plot(range(1, inertia.size+1), inertia, marker='o')
ax.set_xlabel('Number of clusters')
ax.set_ylabel('Inertia')
plt.show()
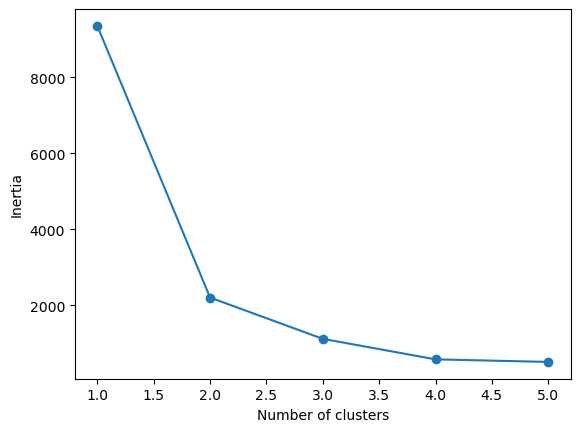
One of the problems with the elbow plot is its interpretation and subjectiveness. Here, the turn of the elbow is probably around two clusters. This makes sense from looking back at the data, which has three clusters grouped close together and another out on its own. So we can understand why we got this result. Even though the data probably has four clusters.