Gaussian Mixture Models#
k-means clustering suffers from a major problem because it calculates the distance between data and the cluster centres; the clusters are necessarily circular/spherical. We can see this in the example below, where the data are skewed.
import numpy as np
import pandas as pd
import seaborn as sns
import matplotlib.pyplot as plt
from sklearn import datasets
from sklearn.cluster import KMeans

data = pd.read_csv('../data/skew.csv')

kmeans = KMeans(n_clusters=3, random_state=0).fit(data)
data['kmeans'] = kmeans.labels_

fig, ax = plt.subplots()
sns.scatterplot(x='x1', y='x2', hue='kmeans', data=data, ax=ax)
plt.show()
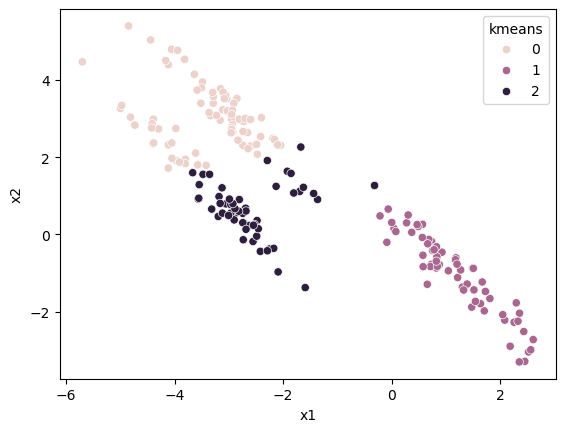
It is clear to us that there are three clusters and what data points are associated with each. However, the Euclidean nature of k-means clustering means that the wrong clusters are identified.
Gaussian mixture models (GMMs) are another clustering method that also follows an expectation-maximisation algorithm. GMMs can overcome the linearity issue of k-means. Let’s see it in action.
from sklearn.mixture import GaussianMixture

gmm_data = data.drop('kmeans', axis=1)
gmm = GaussianMixture(n_components=3).fit(gmm_data)
data['gmm'] = gmm.predict(gmm_data)

fig, ax = plt.subplots()
sns.scatterplot(x='x1', y='x2', hue='gmm', data=data, ax=ax)
plt.show()
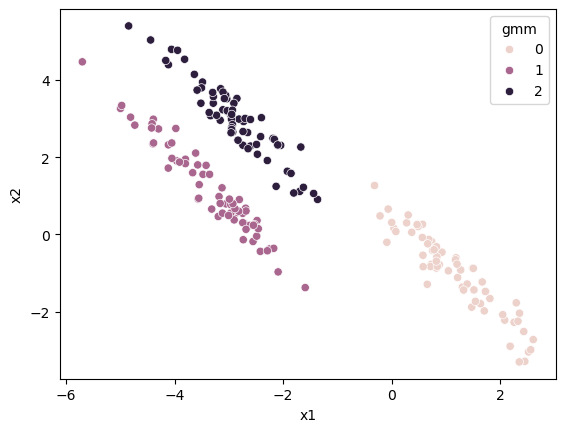
The Gaussian mixture models approach can capture this skew, which is impossible in k-means. We can now look at the algorithm to understand why this is possible.